This guide covers the complete white-label PPC reporting setup: what every client report must include, how to automate delivery in 4 steps, how COREPPC compares to AgencyAnalytics and Whatagraph, and the four mistakes that break otherwise solid setups.
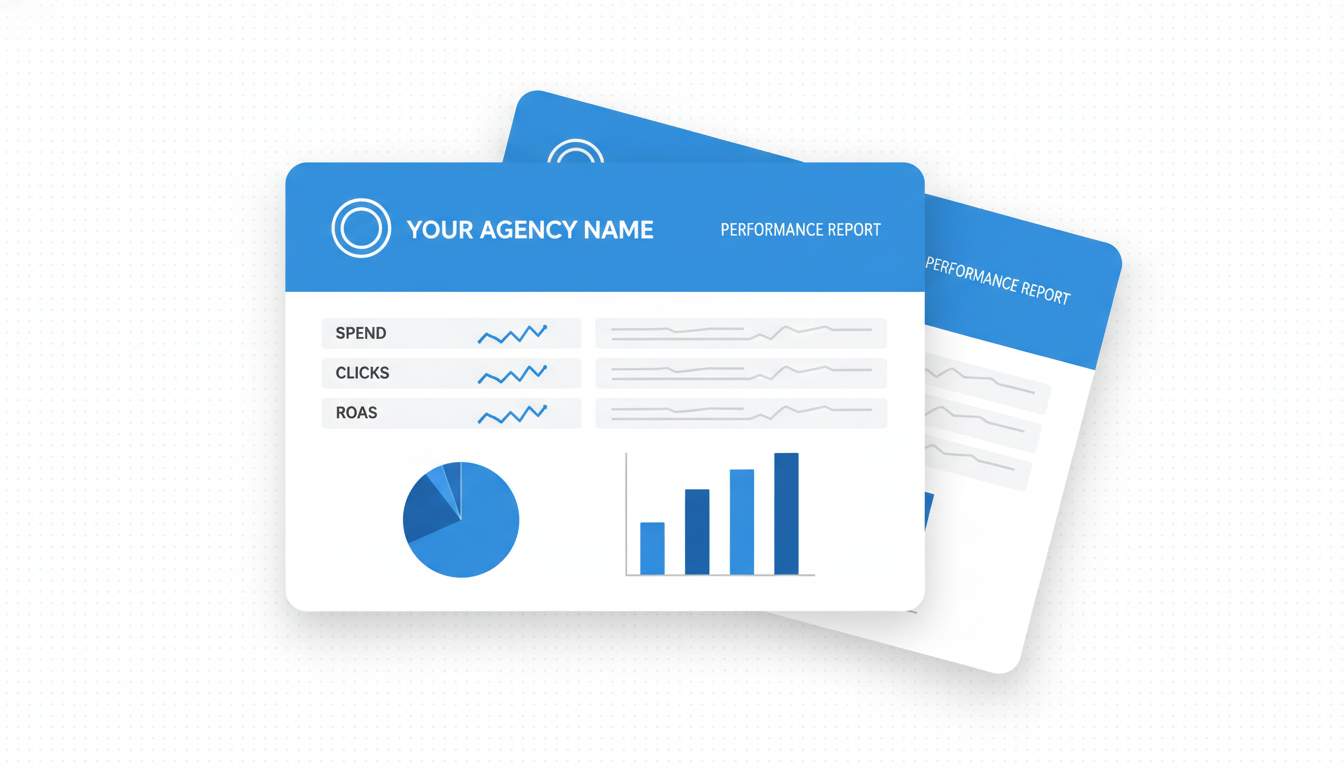
White-label PPC reporting gives clients a branded performance report that shows the agency's logo and name, not the reporting tool's. The standard setup has three components: a data source that pulls directly from Google Ads and Meta Ads via API (no manual CSV downloads), a report template that includes the metrics the client cares about in a layout the agency controls, and a delivery mechanism that sends the report on a defined schedule without requiring the agency to rebuild it each time. Agencies typically report monthly, with a weekly summary for high-spend clients. The metrics that belong in every client report are spend vs. budget, impressions, clicks, CTR, CPC, conversions, CPA, and ROAS for the period. Anything beyond that depends on the client's business model. The most common setup failure: reporting tools that require manual export steps between the ad platform and the report. Any step that requires a human touch breaks the automation and reintroduces the 3-5 hour monthly rebuild problem.
What White-Label PPC Reports Should Include
A white-label PPC report should answer three questions for the client: Did we spend the budget as planned? What did that spend produce? What changes are coming next period? The metrics that answer the first question are spend vs. budget and budget utilization pace. The metrics that answer the second question are clicks, CTR, CPC, conversions, CPA, and for ecommerce clients, ROAS. The metric that answers the third question is whatever the agency diagnosed as the lead optimization lever for the next 30 days, written in one sentence. Reports that include more than this -- impression share, Quality Score, auction insights, ad strength scores -- are agency-facing inputs that most clients cannot act on and that dilute the three core questions. The goal of client reporting is not to show how much work was done. It is to show what the results were and why next month will be better.
Required metrics for every client:
- Spend vs. monthly budget, with percentage utilized
- Impressions, clicks, CTR, CPC
- Conversions and CPA, using the client's primary conversion action
- Conversion value and ROAS (for ecommerce clients only; skip for lead-gen clients where ROAS is misleading without an average deal value)
- Month-over-month comparison for each metric (the trend tells the story more than the number alone)
- Budget utilization: on pace, over, or under
Optional but worth including for the right clients:
- Top 5 campaigns by spend and CPA (shows where the budget is working and where it is not)
- Top 3 audience segments by conversion rate (relevant for Meta campaigns with multiple audience sets)
- One recommended action for next period (the insight the client actually reads and remembers)
What to leave out:
Impression share, Quality Score, ad strength, auction insights. These are optimization inputs for the agency. Clients cannot act on them and their presence adds noise to the three questions the report is trying to answer. Putting them in does not make the report more professional. It makes it harder to read.
How to Automate White-Label Report Delivery (4-Step Setup)
Most agencies rebuild reports manually every month because the connection between their ad accounts and their report template requires human steps. The four steps below eliminate the manual rebuild. Any tool that requires CSV exports between step 1 and step 2 will eventually break.
Connect Ad Accounts Directly via API
The connection must be API-to-API. The reporting tool pulls data from Google Ads and Meta directly, without manual export steps. Manual export workflows -- download CSV from Google Ads, upload to Google Sheets, copy into report -- break when one person is on holiday, when the ad platform changes its export format, or when a column name changes in a platform update. Any step that requires a human touch is a single point of failure.
What to verify: the connection is live, it pulls historical data correctly, and it refreshes automatically on a defined schedule. Nightly refresh is the standard. Any tool requiring a manual sync is not automated.
Build the Report Template Once
Set up the layout, logo, color scheme, and metric selection in the template. Use the client's brand colors if they have a style guide. Use the agency's colors if the client does not specify. All metric cells in the template should pull from the live data connection, not from manually entered numbers. If a metric cell requires typing a number to update, the report is not automated. It is a formatted spreadsheet.
Set the Reporting Period and Delivery Schedule
Monthly reports: set delivery to the 2nd or 3rd of each month covering the prior calendar month. This gives the ad platform 24-48 hours to finalize conversion data. Conversion data in Google Ads can update retroactively for up to 30 days after a click, but the final 24-48 hours after the month closes covers most of the finalization.
Weekly summaries: set delivery for Monday morning covering the prior week. Avoid Friday delivery. Clients do not read reports on Fridays. Monday morning delivery creates a natural touchpoint before the week begins.
Send a Test Report Before the First Client Delivery
Run the report against one month of real data and review every metric for accuracy before it goes to the client. The most common failure at this stage: the CPA formula uses a total conversion count that includes view-through conversions. This inflates the conversion number and understates actual CPA. Verify the conversion column is filtered to the primary conversion action only, not all conversion actions.
One test run catches this. Sending an incorrect report to a client and correcting it in the second month is a credibility problem that takes longer to fix than the test would have taken.
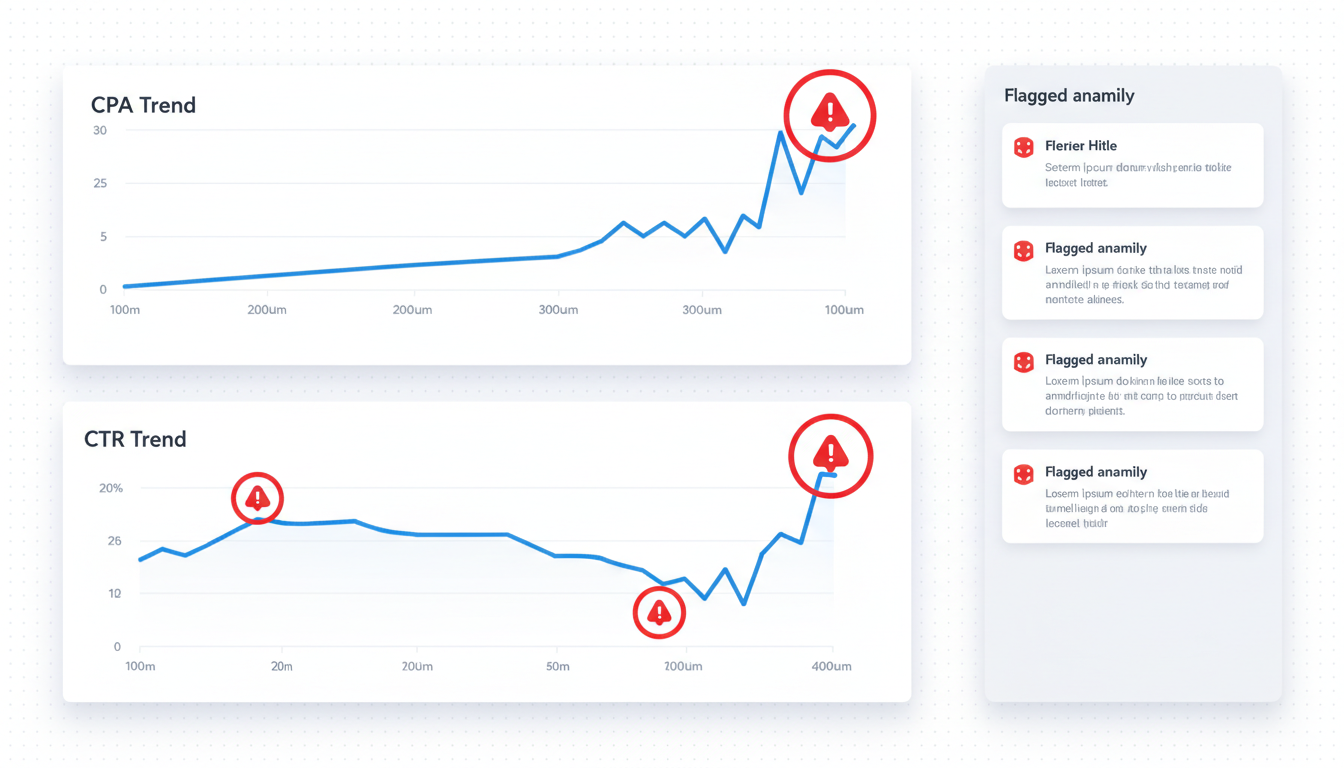
The steps above work with any reporting tool. COREPPC runs the same setup in one place, with anomaly monitoring and audit scoring included.
Set Up Agency Reports in COREPPC
Connect your Google Ads MCC and start generating white-label reports for all your clients from one dashboard.
Set Up Agency ReportsWhite-Label Reporting Tools: How COREPPC Compares
Four tools come up most often when agencies evaluate white-label reporting. Here is an honest comparison. COREPPC does not win every category.
| Feature | AgencyAnalytics | Whatagraph | Swydo | COREPPC |
|---|---|---|---|---|
| Price | From $12/mo | From $249/mo | From $49/mo | Agencies $349/mo |
| Auto-delivery | Not on base plan | Yes | Yes (paid tiers) | Yes |
| Multi-account MCC | No | No | Limited | Yes |
| Anomaly monitoring | No | No | No | Yes |
| White-label output | Yes | Yes | Yes | Yes (paid plans) |
AgencyAnalytics has a larger template library than COREPPC and a lower entry price. Automated email delivery is not included on the base plan. If the agency does not need multi-account MCC integration or anomaly detection between reports, AgencyAnalytics at $12/month is a reasonable starting point.
Whatagraph produces stronger visual output than most competitors. It starts at $249/month for agency plans and handles multi-platform data well. It does not integrate with Google Ads MCC for multi-account management, which matters for agencies running 10+ client accounts under one MCC.
Swydo is a solid mid-tier option at $49/month. Automation is limited on lower pricing tiers, and the multi-platform integration covers most common channels.
COREPPC's advantage is integration, not features. Reporting, anomaly detection, and the Google Ads audit tool are one system, not three separate subscriptions. The multi-account MCC connection means all client accounts are in one place for reporting, monitoring, and auditing. Agencies managing 10+ accounts on separate tools spend meaningful time switching between platforms for each client. See the COREPPC agency dashboard for how the full setup works.
The Most Common White-Label Reporting Mistakes
Setting up automated white-label reporting is the first problem. Running it well month after month is the second. These four mistakes show up repeatedly once the system is live.
Mistake 1: Automating the data but not the insight
The report regenerates on schedule. The commentary section gets copy-pasted from the previous month. Clients notice when the recommendations do not change between months -- and they stop reading. This is one of the most common agency reporting gaps in otherwise solid setups. Fix: block 15 to 20 minutes per client per period for new commentary, every period, without exception.
Mistake 2: One template for all clients
A lead gen client cares about CPL and lead volume. An ecommerce client cares about ROAS and revenue. Using the same template forces irrelevant metrics onto both reports and creates questions the client should not have to ask. Two templates -- one for lead gen, one for ecommerce -- cover 80% of the client types most agencies work with. Fix: build both templates at setup, not after the first confused client email.
Mistake 3: Wrong conversion window in the report
If the client's sales cycle runs 60 days but the report covers a 30-day window, the data understates conversions from campaigns that are actually performing. The numbers look worse than reality. Fix: confirm the client's conversion window at onboarding and match the report date range to it before the first delivery.
Mistake 4: No budget utilization line
Clients on monthly retainers want to see how their budget was used, not just what the performance metrics say. A report without a budget utilization section generates a "did we overspend?" email from the client every single month. Fix: add a single "Budget utilization: $X of $Y monthly budget" line to every report. It takes one data point and prevents a recurring conversation.
Frequently Asked Questions
White-label PPC reporting is a client-facing performance report that shows the agency's branding (logo, colors, name) rather than the reporting tool's name. The client sees a branded document showing their Google Ads and Meta performance. They do not see what software the agency used to generate it. Most agency reporting tools support white-label output on paid plans.
A white-label PPC report should cover: spend vs. monthly budget, impressions, clicks, CTR, CPC, conversions, CPA, and ROAS for ecommerce clients. Add month-over-month comparisons for each metric. Include one recommended action for the next period. Leave out optimization inputs like impression share, Quality Score, and ad strength that clients cannot act on. The report should answer: Did we spend the budget as planned, what did it produce, and what changes are coming next?
The four steps are: (1) connect ad accounts to the reporting tool via direct API integration, not manual CSV exports; (2) build the report template once with the agency's branding and data-driven metric cells; (3) set a delivery schedule so reports send automatically on the 2nd or 3rd of each month for monthly reports; (4) test the report against one real month of data before the first client delivery to verify conversion data is filtered to the primary action only.
Reporting tools with white-label output start at $12/month (AgencyAnalytics base) and go up to $249+/month (Whatagraph agency plans). COREPPC includes white-label reporting as part of its dashboard on paid plans, with the Agencies plan at $349/month covering unlimited client accounts and 500,000 monthly credits pooled across the team.
White-label reporting delivers a static report (PDF or shareable link) with agency branding at a scheduled interval. A client portal is a live dashboard the client logs into directly to see real-time data, also white-labeled. White-label reports are easier to set up and are appropriate for most agency-client relationships. Client portals require more setup and are worth it for clients who actively want to monitor performance between reporting periods.
Set Up Agency Reports in COREPPC
Connect your Google Ads MCC and start generating white-label reports for all your clients from one dashboard. Anomaly monitoring and audit scoring included.
Set Up Agency Reports